
BELLAIRE CAPITAL MANAGEMENT | Market Insights Blog
Chart of the Week: Stocks Make New, All-Time Highs
Week of May 1, 2026 | Kevin Spires, CFA®, CFP®, FRM
Why This Chart?
This week I’m spotlighting SPY — the SPDR S&P 500 ETF Trust — as a proxy for the broad U.S. equity market. After a period of volatility driven by macro headwinds, geopolitical tension, and sector rotation, the S&P 500 has pushed through prior resistance to register new all-time highs. While the breakout is technically constructive and suggests underlying market resilience, the durability of this move is far from certain. Several cross-currents bear close watching in the weeks ahead, and I want to share exactly what I’m monitoring so you can stay informed alongside our clients.
Key Themes to Watch
- Rally May Be Brief — Iran Ceasefire Fragility: Recent diplomatic efforts produced only a fragile ceasefire in the Iran conflict. Any breakdown in those negotiations could rapidly re-ignite risk-off sentiment, pushing energy prices higher and equity markets lower. The new highs may represent a window of optimism rather than a sustainable trend.
- SaaS Sector Remains Under Pressure: Despite the headline index strength, software-as-a-service names continue to lag meaningfully. Elevated interest rates and stretched valuations are compressing multiples across the high-growth software space. Investors rotating out of SaaS into value and dividend-paying names is a headwind that could cap the breadth of any sustained advance.
- Watch Consumer Data Against Rising Gas Prices: The American consumer has been the backbone of economic growth, but higher prices at the pump act as a de facto tax on household budgets. Upcoming retail sales, consumer confidence, and PCE reports will be critical tells. If consumer spending shows signs of cracking under the weight of energy costs, the earnings outlook for consumer discretionary and retail sectors could deteriorate quickly.
This Week’s Chart — SPY (S&P 500 ETF)
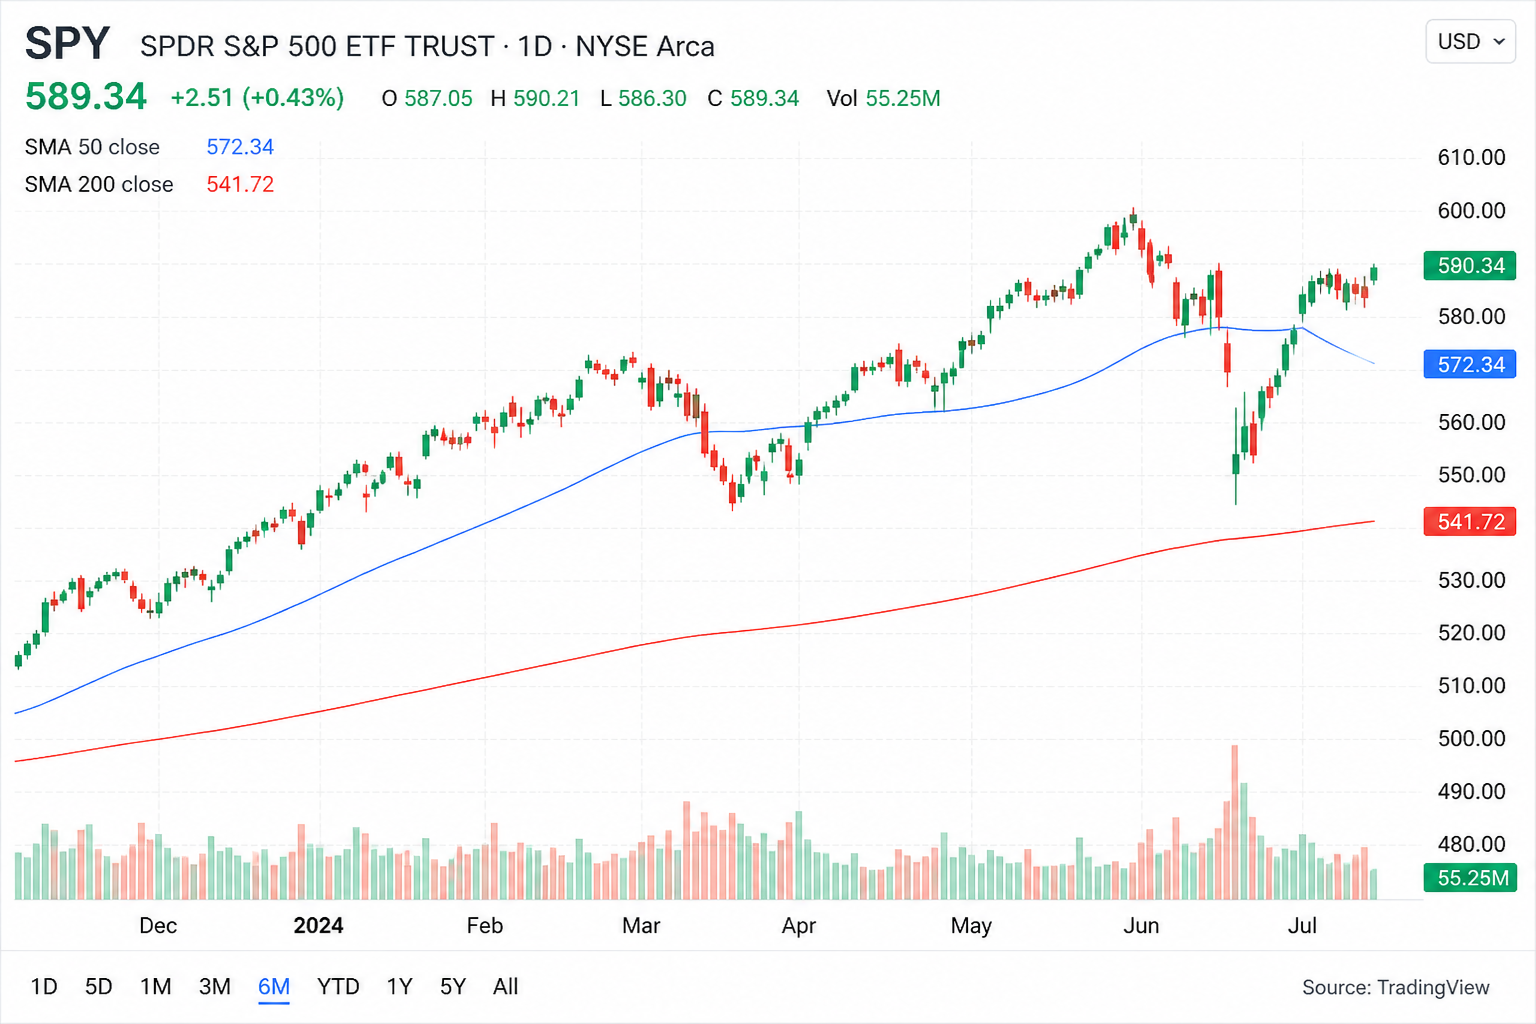
SPY — SPDR S&P 500 ETF Trust | Daily/Weekly Chart | Source: TradingView
Stay Engaged — Chart of the Week, Every Friday
Markets move fast, and so do the signals worth tracking. Every Friday, I publish a new “Chart of the Week” right here on the Bellaire Capital Management Market Insights Blog — selecting the single chart I believe best captures what investors should be watching in the week ahead. Whether it’s an equity index, a sector rotation, a yield curve move, or a macro data series, the goal is always the same: cut through the noise and put the most meaningful picture front and center.
Bookmark this page and check back every Friday for fresh perspective. And if you’re a Bellaire Capital client with questions about how current market conditions affect your portfolio, don’t hesitate to reach out directly. We’re here to help you stay informed and stay on track.
Kevin Spires, CFA®, CFP®, FRM
Principal, Bellaire Capital Management
Fee-Only | Fiduciary | Independent
BELLAIRE CAPITAL MANAGEMENT | Market Insights Blog
DISCLOSURE: This blog post is for informational and educational purposes only and should not be construed as investment advice. Past performance is not indicative of future results. Investing involves risk, including the possible loss of principal. Bellaire Capital Management is a registered investment advisor. Please see our Form ADV for important disclosures.
Recent Posts