Market Insights · September 2026
Can't Fight the Fed
Why the Fed's return to tightening matters for long-duration assets
Kevin Spires, CFA®, CFP®, FRM · Bellaire Capital Management, LLC · September 25, 2026
At the start of 2026, markets expected the Federal Reserve to cut rates once or twice more. That expectation is gone. Under Chairman Kevin Warsh, the Fed has concluded that its credibility is at stake: inflation has stopped moving toward its 2% longer-run goal. On September 17, the FOMC raised the federal funds target range by 0.25% to 3.75–4.00%, and markets now expect at least one more hike.
The bond market has repriced accordingly. As of September 23rd's close, the 10-Year Treasury yield stood at 5.11%, up from 4.18% at year-end and 3.97% at its February low. That is its highest close since July 2007 . Mortgage rates have followed. The 30-year fixed rate has risen from a low of 5.98% in February to 7.03% as of September 24, back above 7% for the first time since January 2025.
The old market saying applies: don't fight the Fed.
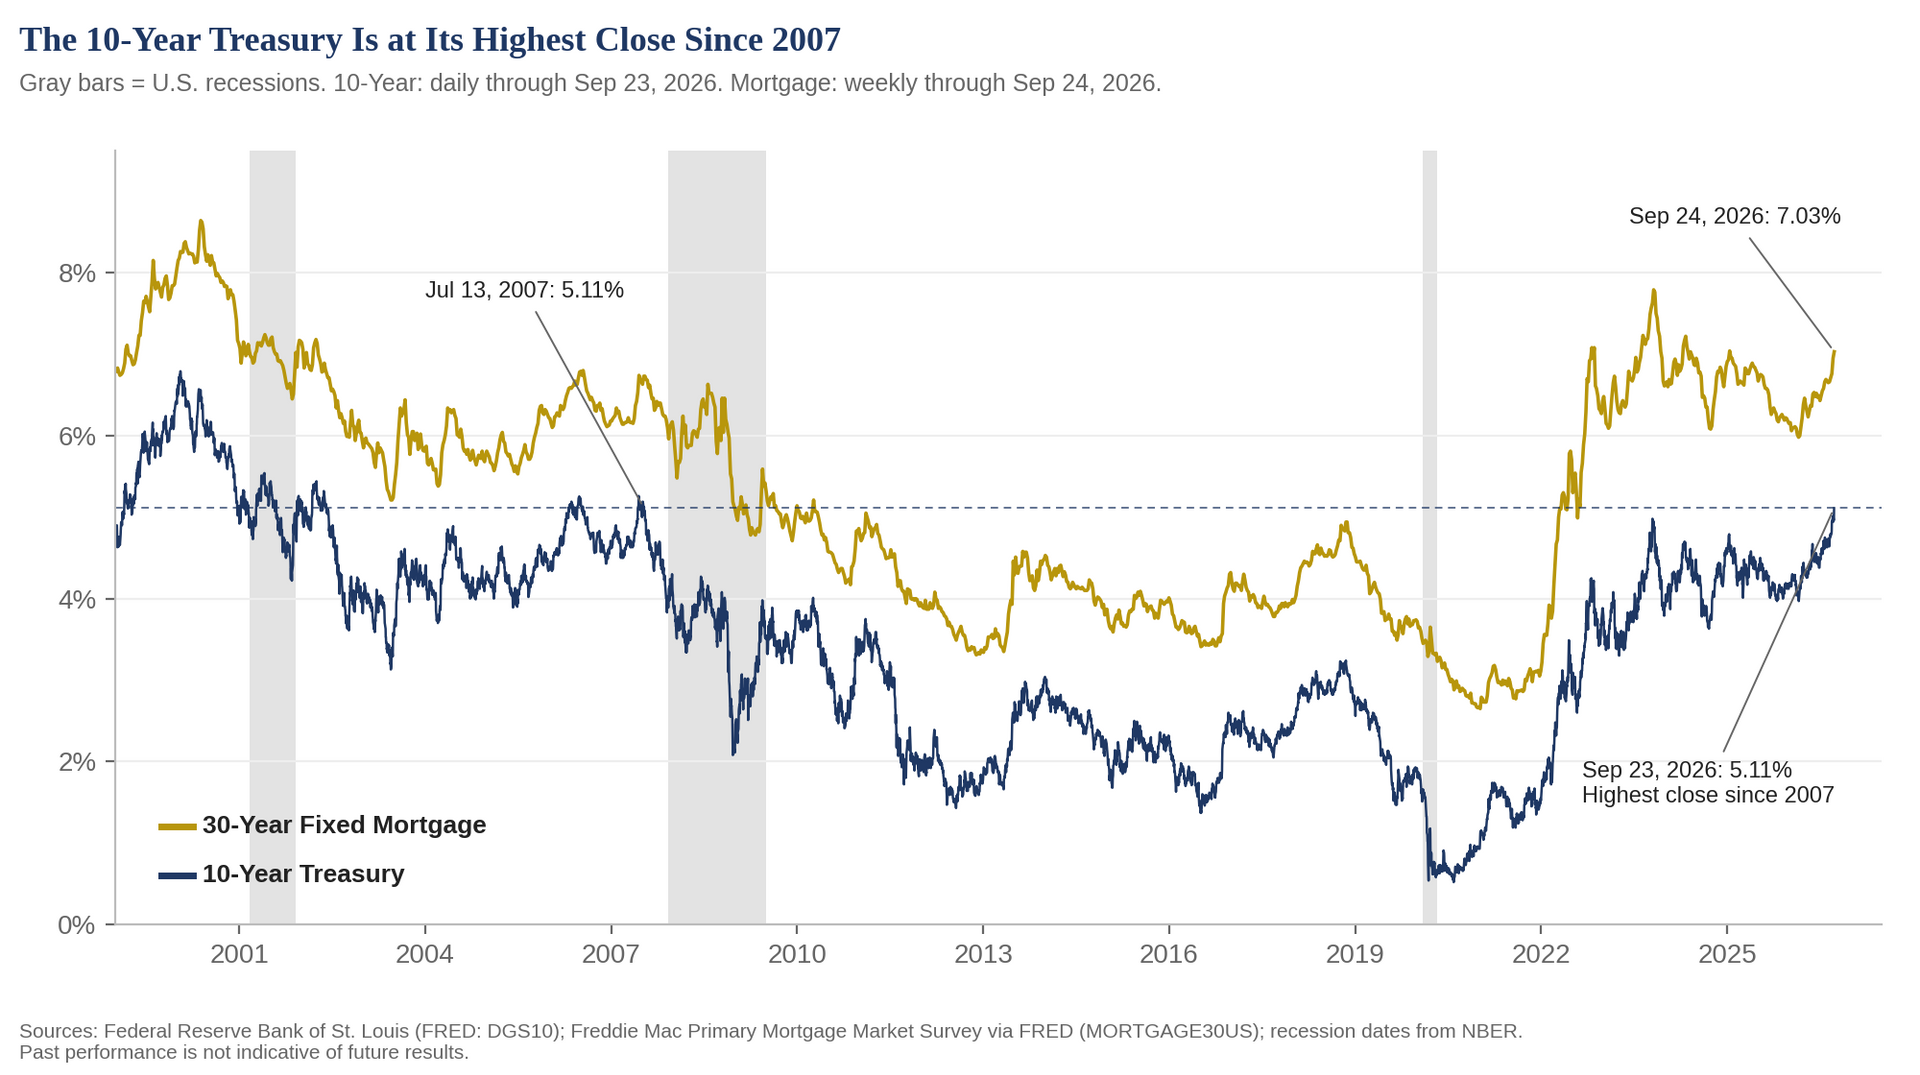
Chart 1. The 10-Year Treasury closed at 5.11% on September 23, 2026, its highest close since July 13, 2007. The 30-year mortgage rate is back above 7%.
It's Murder, Not Suicide
Economists like to say that expansions don't die of old age. MIT economist Rudi Dornbusch put it more bluntly: no postwar expansion "died in bed of old age — every one was murdered by the Federal Reserve." Recessions are rarely self-inflicted. They tend to follow a period in which credit becomes too expensive and too scarce, and the Fed sets the price of credit.
The bond market has historically signaled this with an inverted yield curve, when long-term rates fall below the Fed's overnight rate. Every U.S. recession since 1969 was preceded by one.
Today the curve is not inverted. Long rates have risen faster than the Fed has hiked, and the 10-Year now sits 1.23% above fed funds. The caution is about where hiking cycles have historically led. Since 1958, the typical tightening cycle has added about 4 percentage points to the fed funds rate, and only 2 of 14 added less than 2 points. If the Fed follows even the low end of that history, a fed funds rate of 5.5% or higher is well within reach.
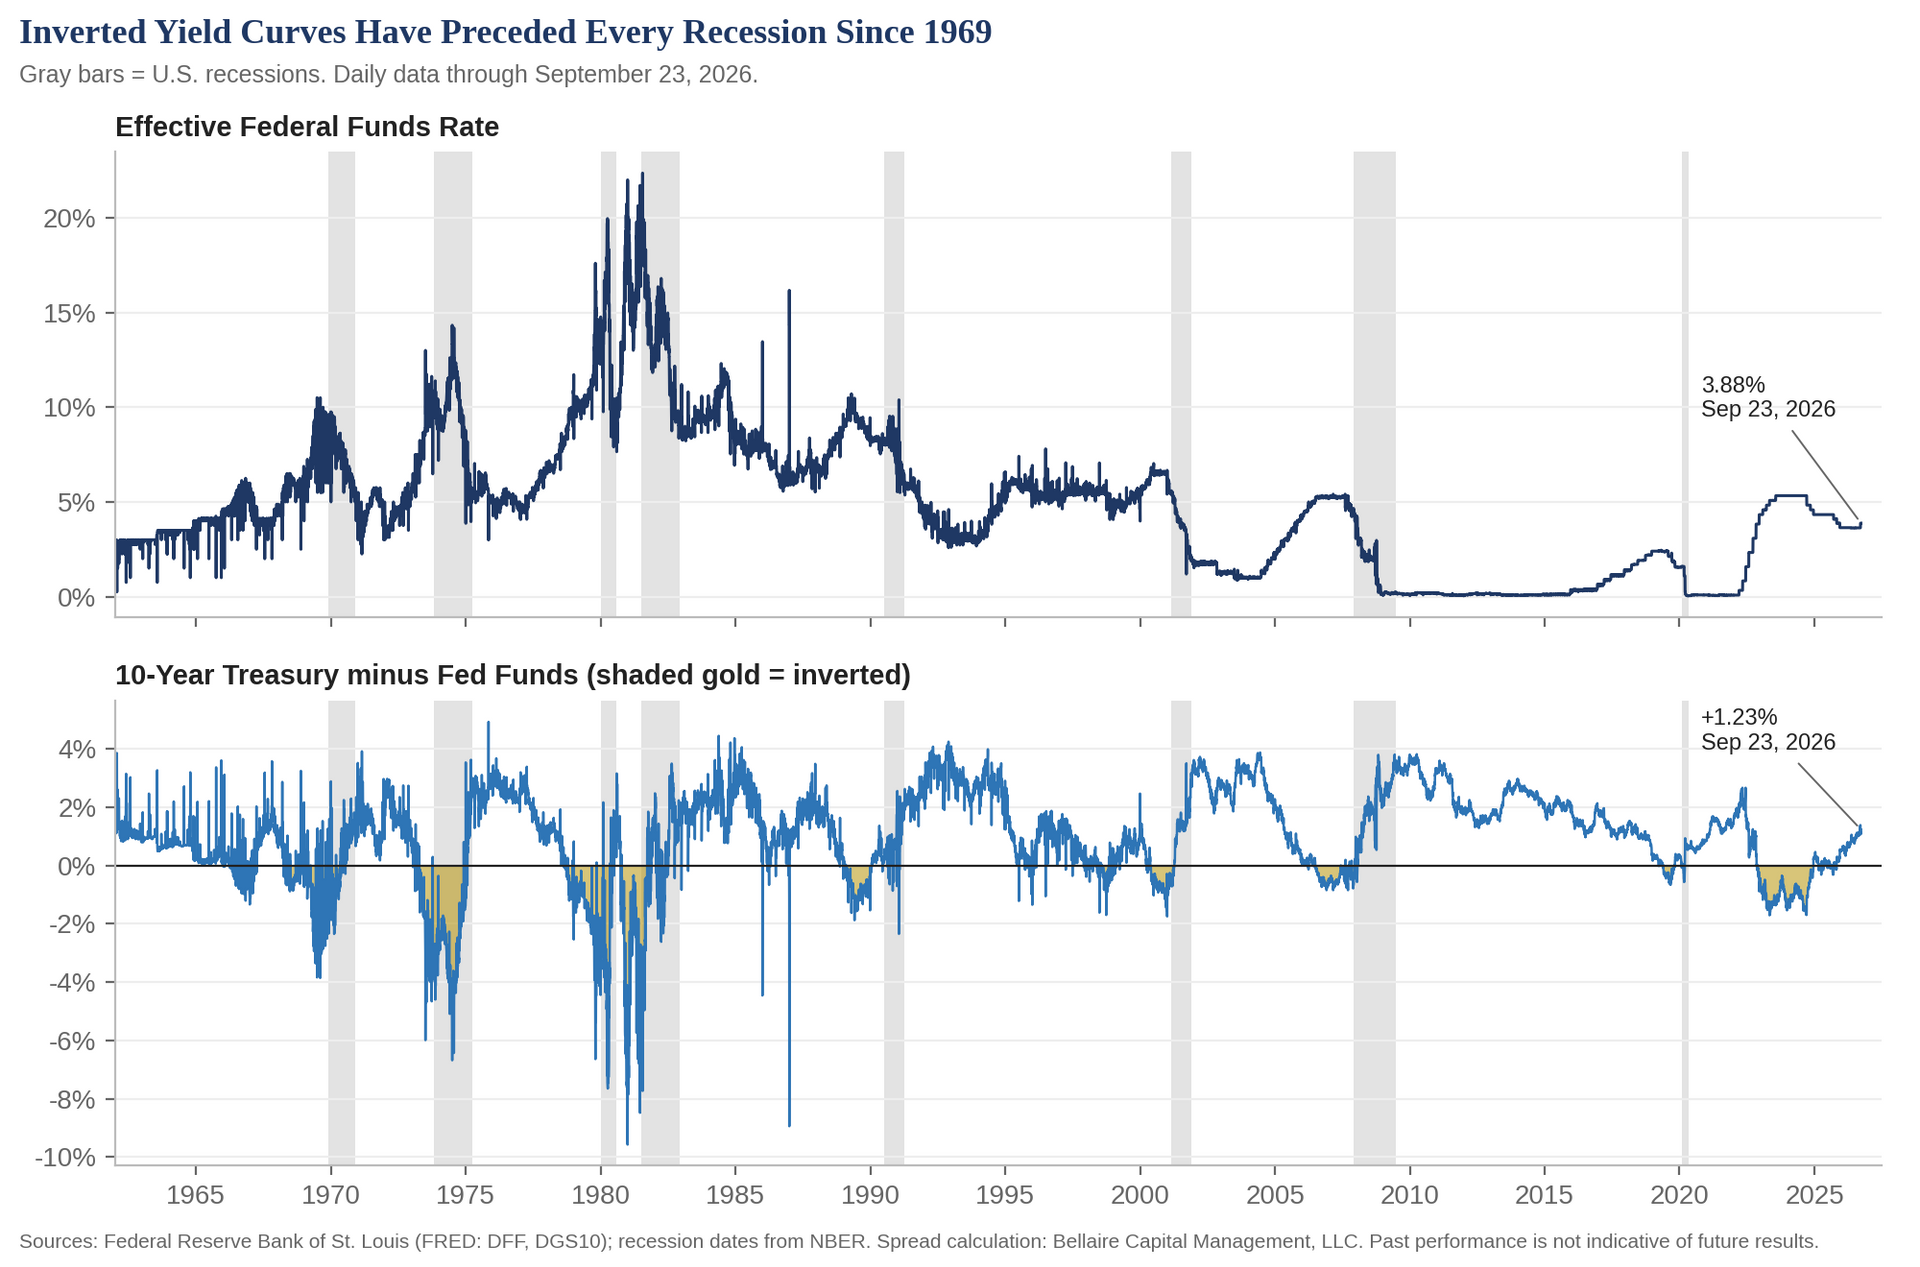
Chart 2. Inverted yield curves (gold) preceded every recession (gray) since 1969. The curve is not inverted today.
Why 2022–2024 Was Different
The curve stayed inverted from late 2022 through 2024, and no recession followed. Three forces cushioned the blow. We believe none of them will help to the same degree this time.
- Fiscal policy leaned hard the other way. Policymakers know the history too. In retrospect, very expansive fiscal policy buffered much of the Fed's tightening. The 12-month federal deficit ran between roughly 5.5% and 8.5% of GDP from mid-2022 through 2025 — recession-sized deficits in a full-employment economy. Before the pandemic, in 2019, it ran below 5%.
- The profit channel never engaged. Tight money usually reaches the economy through corporate profits: borrowing costs rise, margins shrink, and companies cut back. This time, corporations had termed out their debt at low post-Covid rates and earned more on their cash as rates rose. From the first hike in early 2022 through the end of 2023, nonfinancial corporate net interest costs fell 39.5%, while domestic corporate profits rose 19.6%. In every prior hiking cycle since 1988, net interest costs rose, by 14% to 31%.
- The AI investment boom began just as rates rose. Business investment normally falls when borrowing gets more expensive. Instead, 2022 marked the start of the AI buildout, funded largely from the enormous cash flows of the largest technology companies.
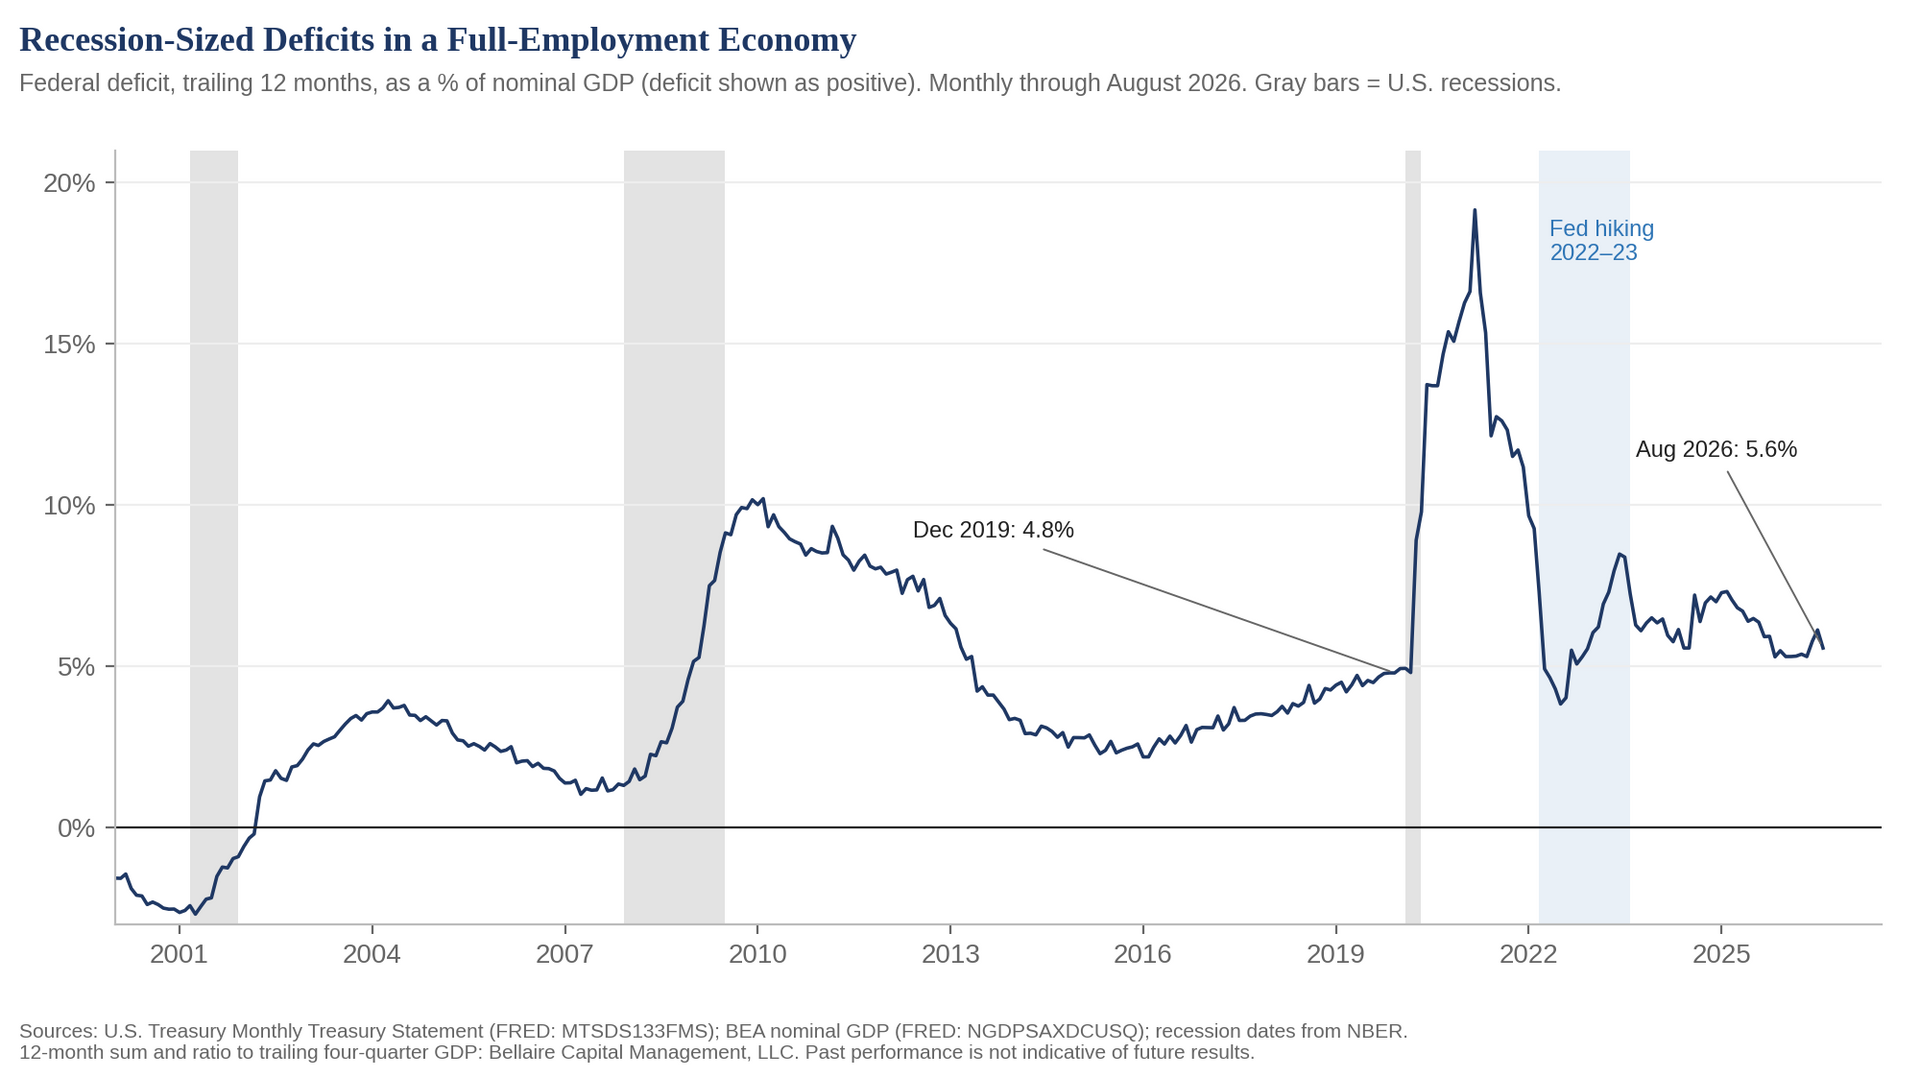
Chart 3. The 12-month federal deficit ran at recession-sized levels throughout the 2022–23 hiking cycle.
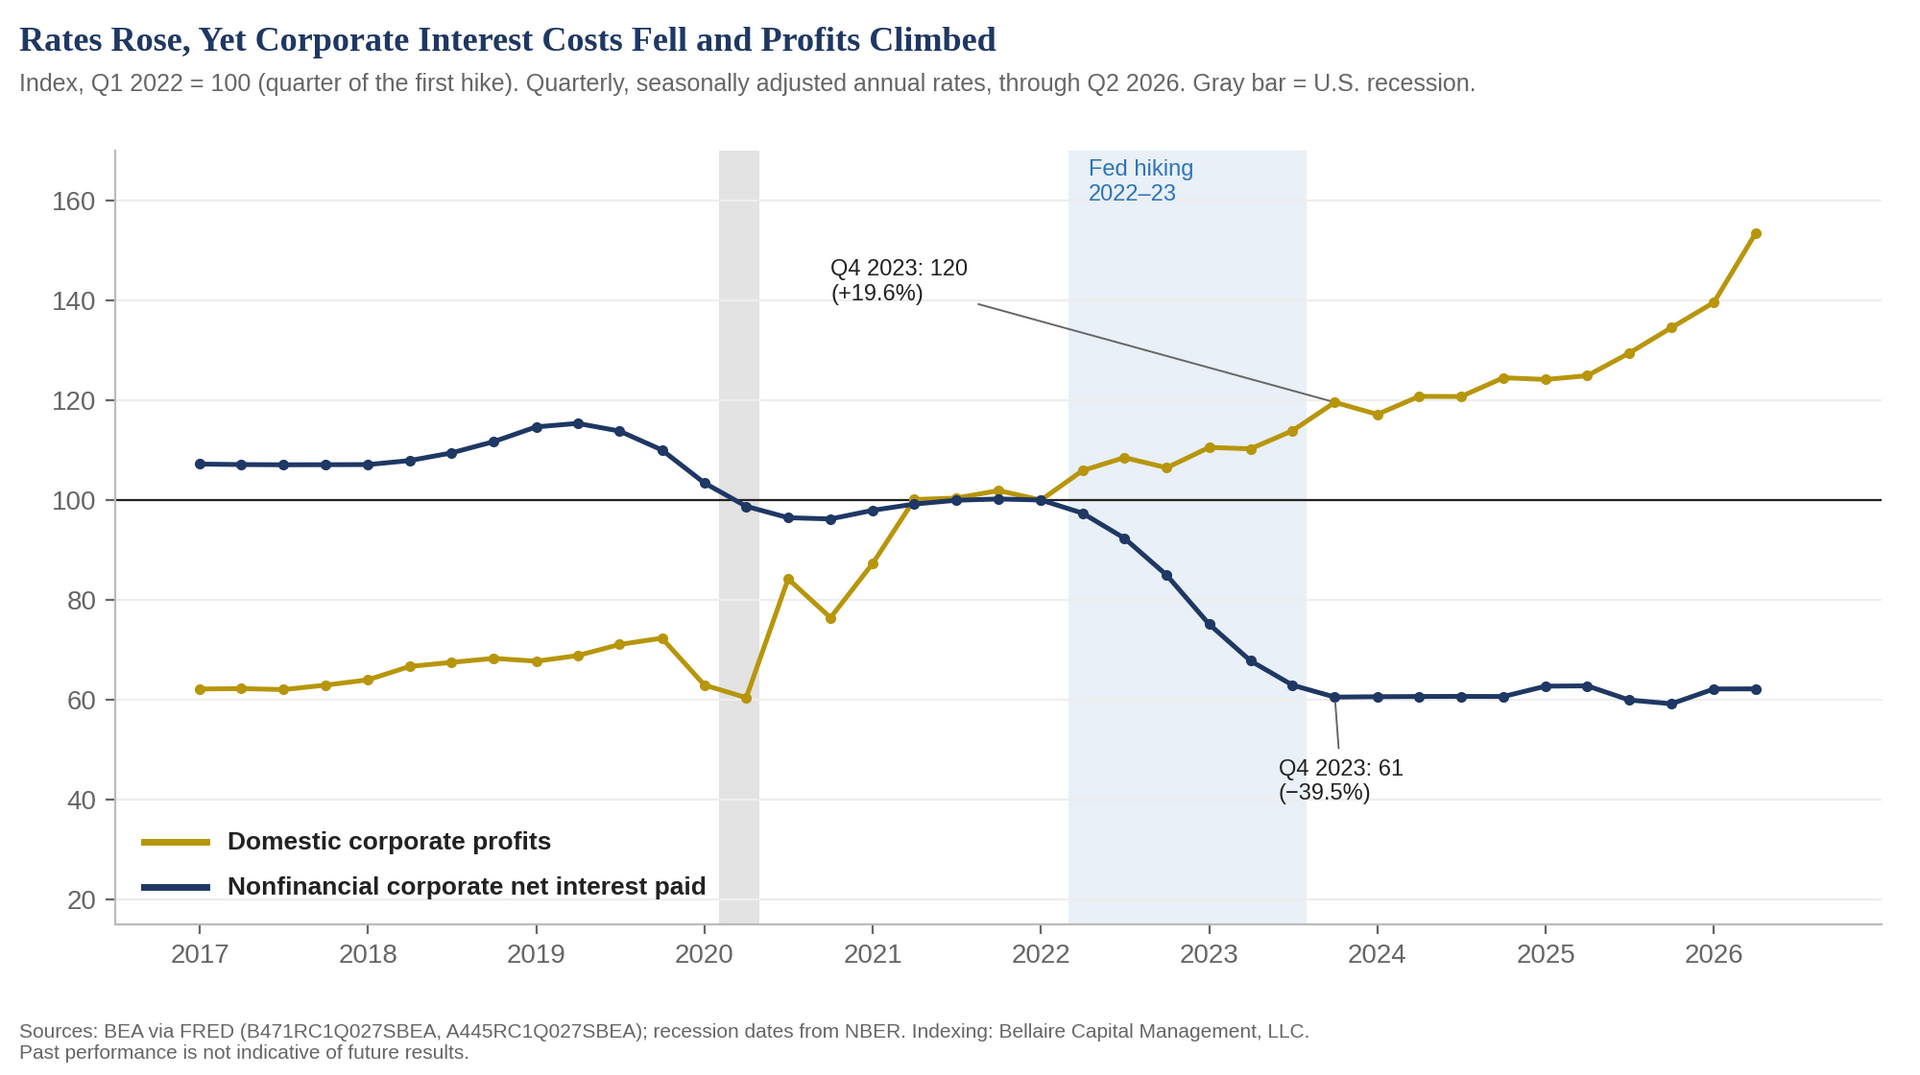
Chart 4. As the Fed hiked, nonfinancial corporate net interest costs fell 39.5% while domestic corporate profits rose 19.6% (Q1 2022 to Q4 2023).
This time, those tailwinds look neutral at best. Deficits are already large, leaving less room to lean against the Fed. Corporate net interest costs have stopped falling, and low-rate debt is gradually maturing into a 5% world. And the AI buildout is now being financed with debt: hyperscaler bond issuance rose from $17 billion in 2024 to $194 billion in just the first half of 2026, 1 and new borrowing now funds roughly a third of their capital spending, up from 9% two years ago. 2 Spending financed with debt is sensitive to interest rates in a way that spending financed from profits is not. (We'll explore this in a future piece.)
The One Ring
In investing there is one rate to rule them all: the federal funds rate. It is the economy's closest thing to a true risk-free rate, and every other discount rate is built on top of it. Mortgage rates, corporate borrowing costs, and the rate an investor uses to value a company's future profits all start there.
When the risk-free rate rises, the present value of every future cash flow falls. The further out those cash flows are, the larger the effect. That is duration , and it is why the repricing is not evenly shared:
- Long-term bonds have already felt it, as the 10-Year's move to 5.11% shows.
- Growth stocks are valued mostly on profits expected years from now, which makes them long-duration assets in equity form.
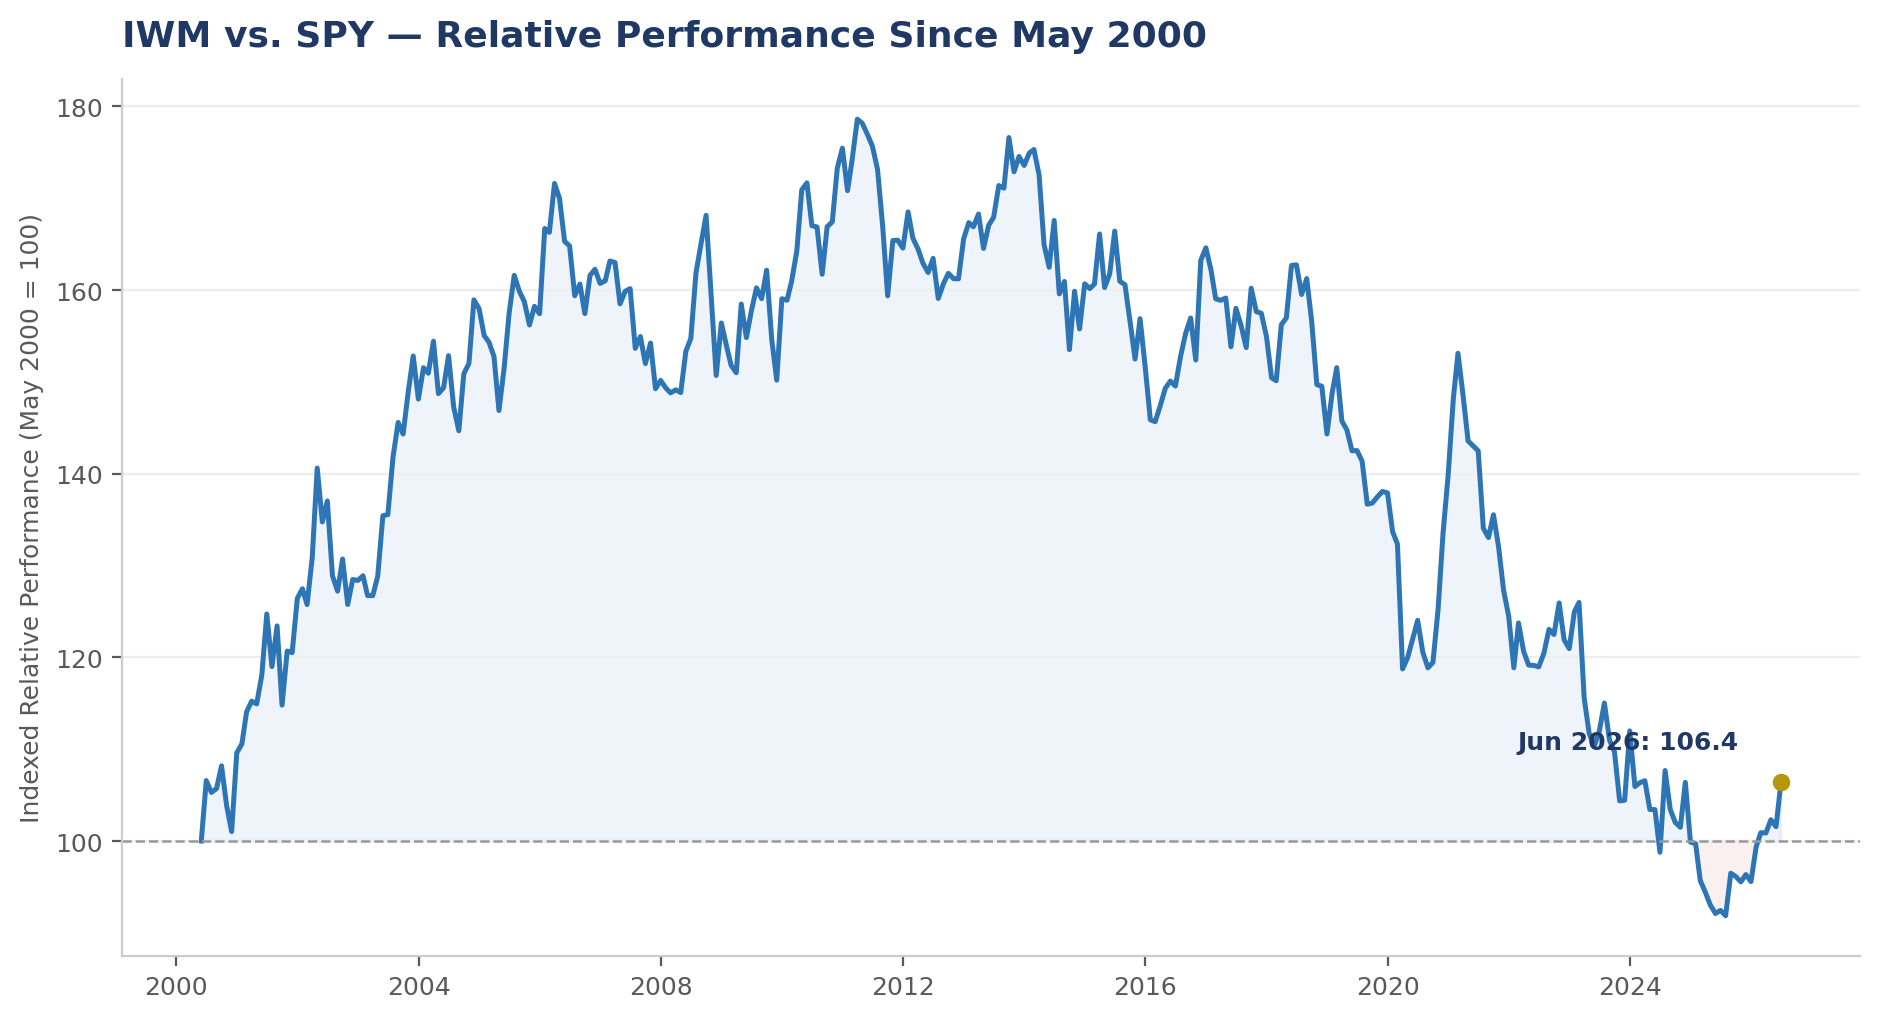
- Small-cap stocks feel it twice. Their earnings tend to be further out, and they rely more on floating-rate and short-term borrowing, so their interest costs rise with each hike.
- Emerging-market growth equities feel it through the dollar. Higher U.S. rates tend to strengthen the dollar, which tightens financial conditions abroad and reduces returns for U.S. investors.
The Bottom Line
Strategies that depended on falling rates face a headwind until the FOMC signals it is done. Don't fight the Fed.
1 J.P. Morgan Asset Management, "Can credit markets absorb the AI buildout?", August 5, 2026.
2 FactSet Insight, "Hyperscalers Tap External Financing as AI Capex Outruns Cash Flow," July 23, 2026.
Data Sources & Methodology. Federal Reserve Bank of St. Louis (FRED): effective federal funds rate (DFF), 10-Year Treasury constant maturity (DGS10), 30-year fixed mortgage rate (MORTGAGE30US, Freddie Mac Primary Mortgage Market Survey), monthly federal surplus or deficit (MTSDS133FMS, U.S. Treasury Monthly Treasury Statement), nominal GDP (NGDPSAXDCUSQ), nonfinancial corporate net interest and miscellaneous payments (B471RC1Q027SBEA, BEA), and domestic corporate profits with inventory valuation and capital consumption adjustments (A445RC1Q027SBEA, BEA). Recession dates: National Bureau of Economic Research (NBER). Hiking-cycle magnitudes are measured trough to peak on monthly averages of the effective federal funds rate. The 10-Year minus fed funds spread, hiking-cycle, 12-month deficit-to-GDP, indexing, and percent-change calculations are by Bellaire Capital Management, LLC. This document is prepared for informational purposes and is subject to compliance review prior to distribution.
For informational and educational purposes only. This document does not constitute investment, tax, or legal advice. Bellaire Capital Management, LLC is a Registered Investment Advisor. Registration does not imply a certain level of skill or training. Consult qualified professionals regarding your specific situation. Please review BCM's Form ADV for full disclosures.